The most important sectors of Sweden’s economy in 2016 were public administration, defence, education, human health and social work activities (21.5 %), industry (19.9 %) and wholesale and retail trade, transport, accommodation and food services (17.9 %). .Currency: SEK GDP Per Capita: 51,610.1 USD (2019) GDP Growth Rate: 1.2%annual change (2019) Gross Domestic Product: 596,299.93 (2019) GNI Per Capita: 54,640 PPP dollars (2018)
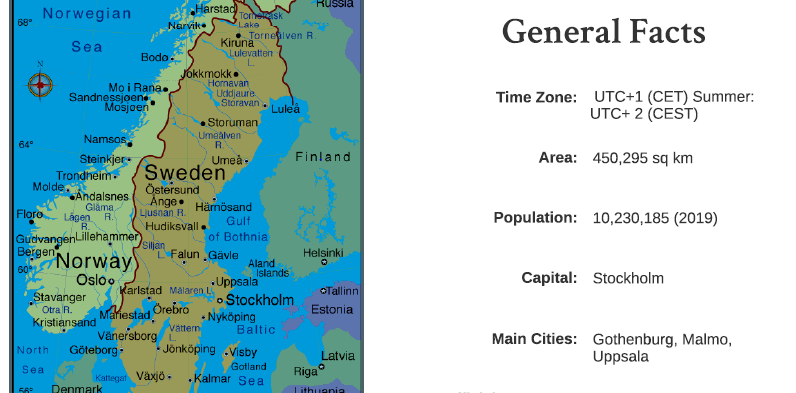
Sweden
Foreign Trade
Sweden’s main export partners are Norway, Germany, and the UK, while its main import partners are Germany, Norway, and the Netherlands. Exports: The top exports of Sweden are Cars ($11.9B), Refined Petroleum ($10B), Packaged Medicaments ($6.9B), Vehicle Parts($5.6B), and Broadcasting Equipment ($3.74B). Imports:The top imports of Sweden are Cars ($8.81B), Crude Petroleum ($8.75B), Refined Petroleum ($6.87B), Vehicle Parts ($6.42B), and Broadcasting Equipment ($5.17B). Sweden exports mostly to Germany ($17.4B), Norway ($15.2B), Denmark ($11.2B), United States ($11.1B), and Netherlands ($9.44B), and imports mostly from Germany ($30B), Netherlands ($13.8B), Denmark ($11.2B), Norway ($9.8B), and China ($7.92B) 2018, Sweden exported $162B and imported $160B, resulting in a positive trade balance of $2.37B
Finances with European Union
Breakdown of Sweden’s finances with the EU: Total EU spending in Sweden: 1.814 billion Total EU spending as % of Swedish gross national income (GNI): 0.38% Total Swedish contribution to the EU budget:3.303 billion Swedish Contribution to the EU budget as % of its GNI: 0.70%