Economy
In 2018 Netherlands was the number 17 economy in the world in terms of GDP (current US$), the number 7 in total exports, the number 8 in total imports, and the number 20 most complex economy according to the Economic Complexity Index (ECI). In 2018, Netherlands exported $550B and imported $614B, resulting in a negative trade balance of -$63.4B. Currency: EURO GDP Per Capita: 53, 024.06 USD (2018) GDP Growth Rate: 2.6% annual change (2018) Gross Domestic Product: 913.7 billion USD (2018) GNI Per Capita: 53,200 PPP dollars (2019)
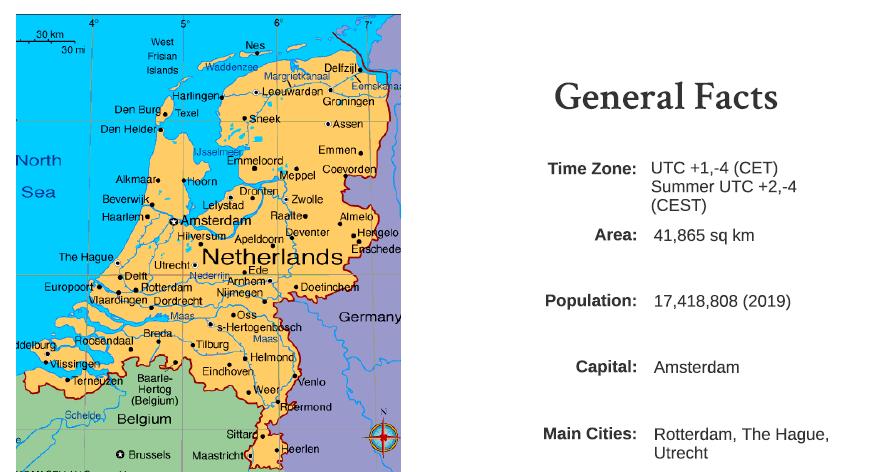
Netherlands
Foreign Trade
Netherlands exports mostly to Germany ($111B), Belgium-Luxembourg ($71.3B), United Kingdom ($50.7B), France($38.3B), and United States ($25.3B), and imports mostly from Germany ($93.6B), China ($63.7B), Belgium-Luxembourg ($57.5B), United States ($44.9B), and Russia ($41B). Export: The top exports of Netherlands are Refined Petroleum($46.9B), Broadcasting Equipment ($18.1B), Packaged Medicaments ($16.2B), Computers ($11.2B), and Office Machine Parts ($11.2B). Import: The top imports of Netherlands are Crude Petroleum ($55.4B), Refined Petroleum ($48B), Broadcasting Equipment ($21B), Computers ($17.3B), and Packaged Medicaments ($16B). Netherlands exports mostly to Germany ($111B), Belgium-Luxembourg ($71.3B), United Kingdom ($50.7B), France ($38.3B), and United States ($25.3B), and imports mostly from Germany ($93.6B).
Finances with European Union
Breakdown of Netherland’s finances with the EU: Total EU spending in Austria: 2.470 billion Total EU spending as %of Austrian gross national income (GNI): 0.32% Total Austrian contribution to the EU budget: 4.845 billion Austrian contribution to the EU budget as %of its GNI: 0.62%